
 BADGE - DATA
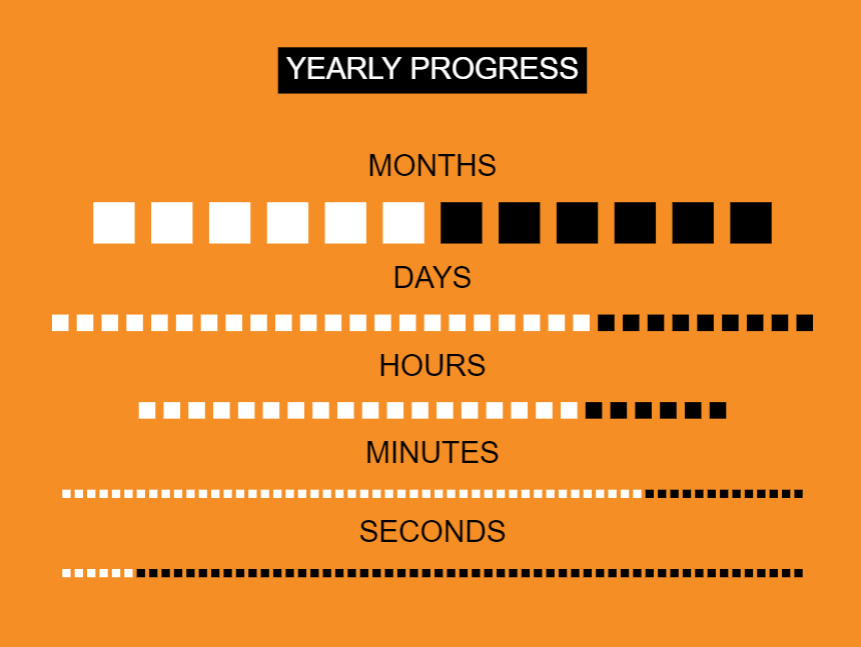
Visualize the date and time with rectangles. This is not interactive but it should update each second.
Below are some hints if you need them!
1. Store a variable for each Label and a Tile (12, 31, 24, 60, 60 columns, each with 1 row) of Rectangles. This will be 5 labels and 5 tiles.
2. Tile all these with 1 column and 10 rows and set the unique parameter (after spacingH and spacingV) to true.
3. In an interval of 1 second, store a new Date() in a date variable. Make the inverval start right away. Do the following test for each of the months, days, hours, minutes and seconds
using date.getMonth(), date.getDate(), date.getHours(), date.getMinutes() and date.getSeconds():
- store the value in a variable - for instance, const month = date.getMonth()
- loop through the items in the matching Tile (for instance monthTile) and get the item and the loop index i
- test if i is less than the value (in the case of the month use less than or equal) and set the item color to white if true
- else set the item color to black